Prometheus部署及使用
1. 启动容器环境
启动带ssh容器.1
docker run -it --name prometheus --privileged -p 36021:22 -p 36022-36030:36022-36030 centos:7 bash
安装相关软件.1
yum install -y wget openssh-server net-tools
生成sshkey,修改ssh密码,启动ssh.1
ssh-keygen -t rsa -f /etc/ssh/ssh_host_rsa_key
passwd
/usr/sbin/sshd
配置ssh免密
/etc/ssh/sshd_config 文件中解开下面的注释
1 | RSAAuthentication yes PubkeyAuthentication yes AuthorizedKeysFile .ssh/authorized_keys |
向 ~/.ssh/authorized_keys 中贴入本地的 id_rsa.pub 内容,重启sshd
2. 安装、启动 prometheus
下载最新的 lts 版本1
wget https://github.com/prometheus/prometheus/releases/download/v2.43.0/prometheus-2.43.0.linux-amd64.tar.gz
解压1
tar zxvf prometheus-2.43.0.linux-amd64.tar.gz
进入解压目录1
cd prometheus-2.43.0.linux-amd64
创建数据目录(也可以使用三方存储,见文档 Storage | Prometheus)1
mkdir -p datamkdir -p data
由于容器的端口暴露范围是 36022~36030,将 prometheus.yml 中监控自身的 9090 端口改为 36022
在 36022 端口启动 prometheus
1 | ./prometheus --web.listen-address=:36022 |
此时即可通过 http://xxx.xxx.xxx.xxx:36022/ 访问 prometheus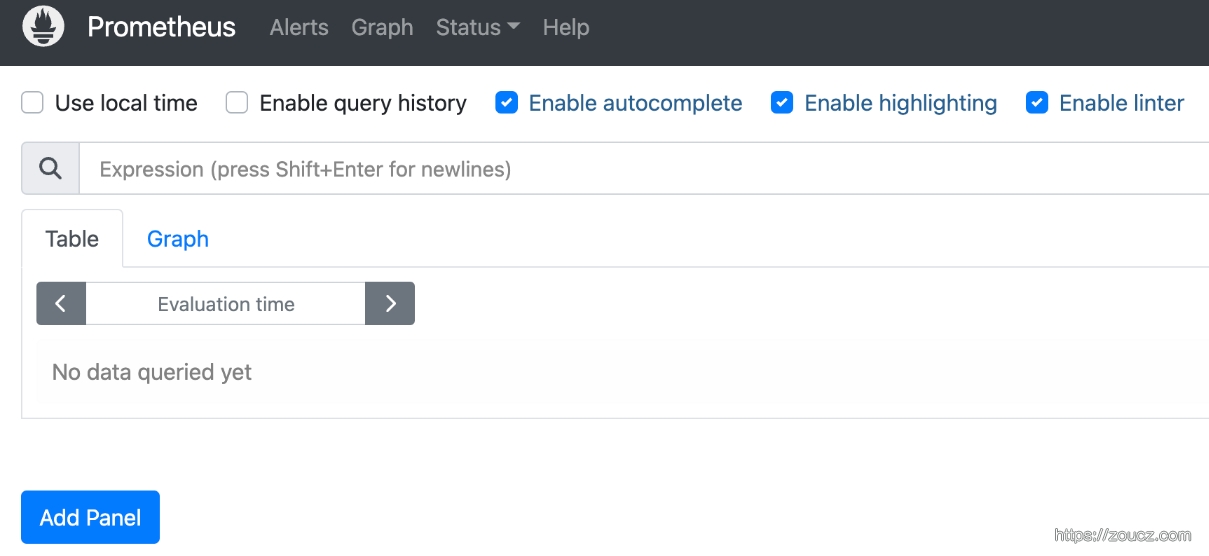
3. 数据采集

prometheus 是 pull 系统
3.1 安装exporter
以采集机器节点指标(CPU, 内存,磁盘等信息CPU, 内存,磁盘等信息)上报为例
下载最新的 lts 版本1
wget https://github.com/prometheus/node_exporter/releases/download/v1.5.0/node_exporter-1.5.0.linux-amd64.tar.gz
解压1
tar zxvf node_exporter-1.5.0.linux-amd64.tar.gz
启动1
./node_exporter --web.listen-address=:36023
此时即可通过 http://xxx.xxx.xxx.xxx:36023/ 访问 node_exporter

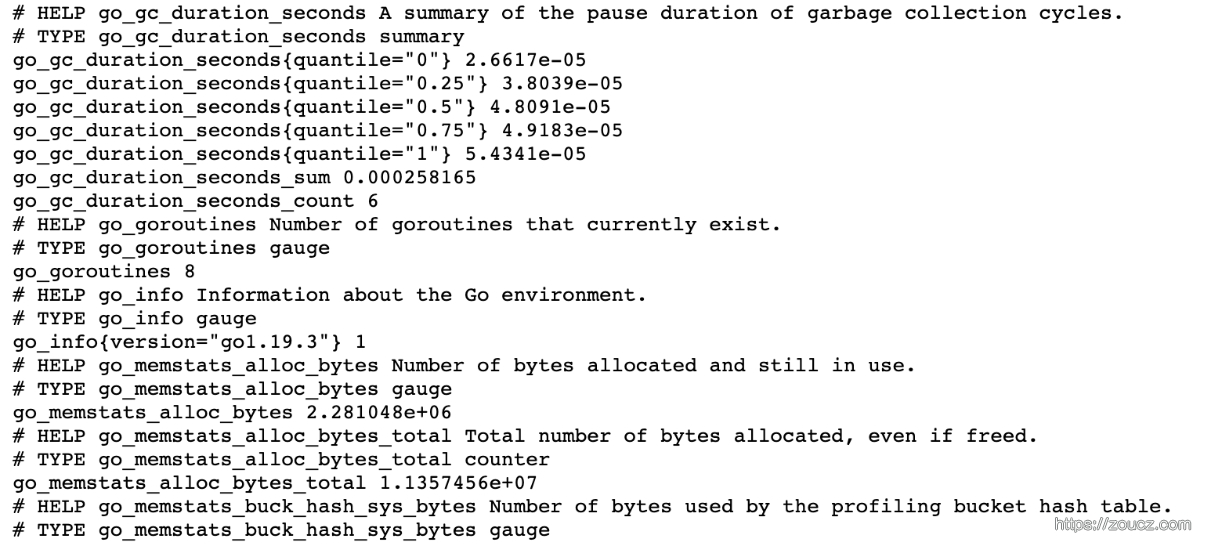
- HELP用于解释当前指标的含义
- TYPE 则说明当前指标的数据类型
- go_gc_duration_seconds{quantile=”0”} 2.6617e-05 是一条指标在此时此刻的一个样本,其构成含义是
{
3.2 添加本地采集配置
修改 prometheus 目录下的 prometheus.yml 文件,添加上一步添加的 node_exporter,然后重启 prometheus 或者 reload。curl -X POST http://localhost:36022/-/reload
1 | scrape_configs: - job_name: 'prometheus' static_configs: - targets: ['localhost:36022'] # 采集node exporter监控数据 - job_name: 'node' static_configs: - targets: ['localhost:36023'] |
访问 prometheus 的网页,输入 up 查询,即可看到采集 job 。
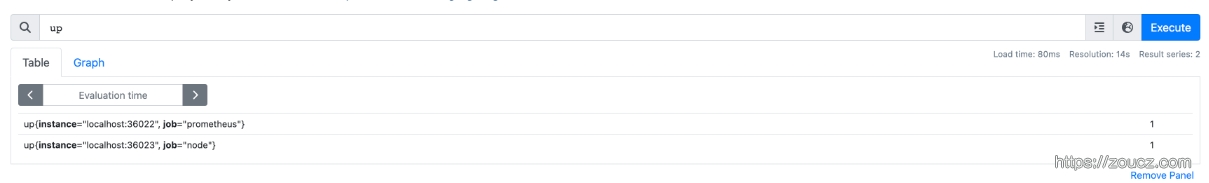
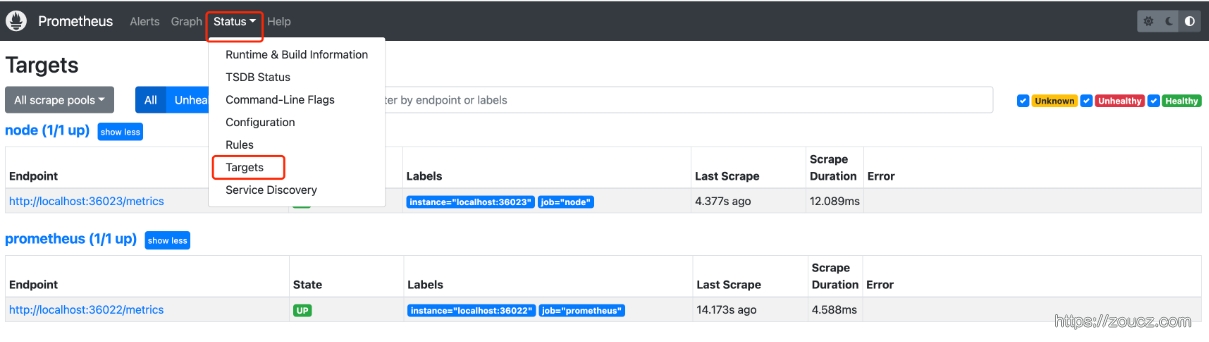
除了通过使用 ‘up’ 表达式查询当前所有Instance的状态以外,还可以通过Prometheus UI中的Targets页面查看当前所有的监控采集任务,以及各个任务下所有实例的状态:
3.3 添加动态采集配置
上面的示例中,使用的是静态配置 (static_configs) 的方式定义监控目标。
prometheus还支持与DNS、Consul、E2C、Kubernetes等方式自动发现监控目标。
详见配置文档:Configuration | Prometheus 中的 …_sd_config.
4. 概念理解
4.1 指标(metric)
这就是一个指标,包含指标名,指标label等信息。
1 | <metric name>{<label name>=<label value>, ...} |
指标的名称(metric name)代表被监控样本的含义,指标名称只能由ASCII字符、数字、下划线以及冒号组成并必须符合正则表达式[a-zA-Z_:][a-zA-Z0-9_:]*。
标签(label)反映了当前样本的特征维度,通过这些维度 prometheus 可以对样本数据进行过滤,聚合等。标签的名称只能由ASCII字符、数字以及下划线组成并满足正则表达式[a-zA-Z_][a-zA-Z0-9_]*。
其中以 __ 作为前缀的标签,是系统保留的关键字,只能在系统内部使用。标签的值则可以包含任何Unicode编码的字符。在Prometheus的底层实现中指标名称实际上是以 __name__=<metric name>的形式保存在数据库中的,因此以下两种方式等价:
1 | api_http_requests_total{method="POST", handler="/messages"} {__name__="api_http_requests_total",method="POST", handler="/messages"} |
在 prometheus 源码中也可以找到指标(Metric)对应的数据结构,如下所示:
1 | type Metric LabelSet type LabelSet map[LabelName]LabelValue type LabelName string type LabelValue string |
4.2 样本(sample)
prometheus 针对一个指标,在一个时间点的采样,称为一个样本(sample)。
样本由以下三部分组成:
- 指标(metric):metric name 和 label set
- 时间戳(timestamp):一个精确到毫秒的时间戳
- 样本值(value): 一个float64的浮点型数据表示当前样本的值(从 prometheus v2.4.0 开始还支持了直方图类型)。
4.3 样本数据类型
Counter 计数器
只增不减的计数器Counter:只增不减的计数器。
如 node_cpu_guest_seconds_total CPU 使用总时间、http_requests_total http 请求次数。
Gauge 仪表盘
可增可减的仪表盘Gauge:可增可减的仪表盘。
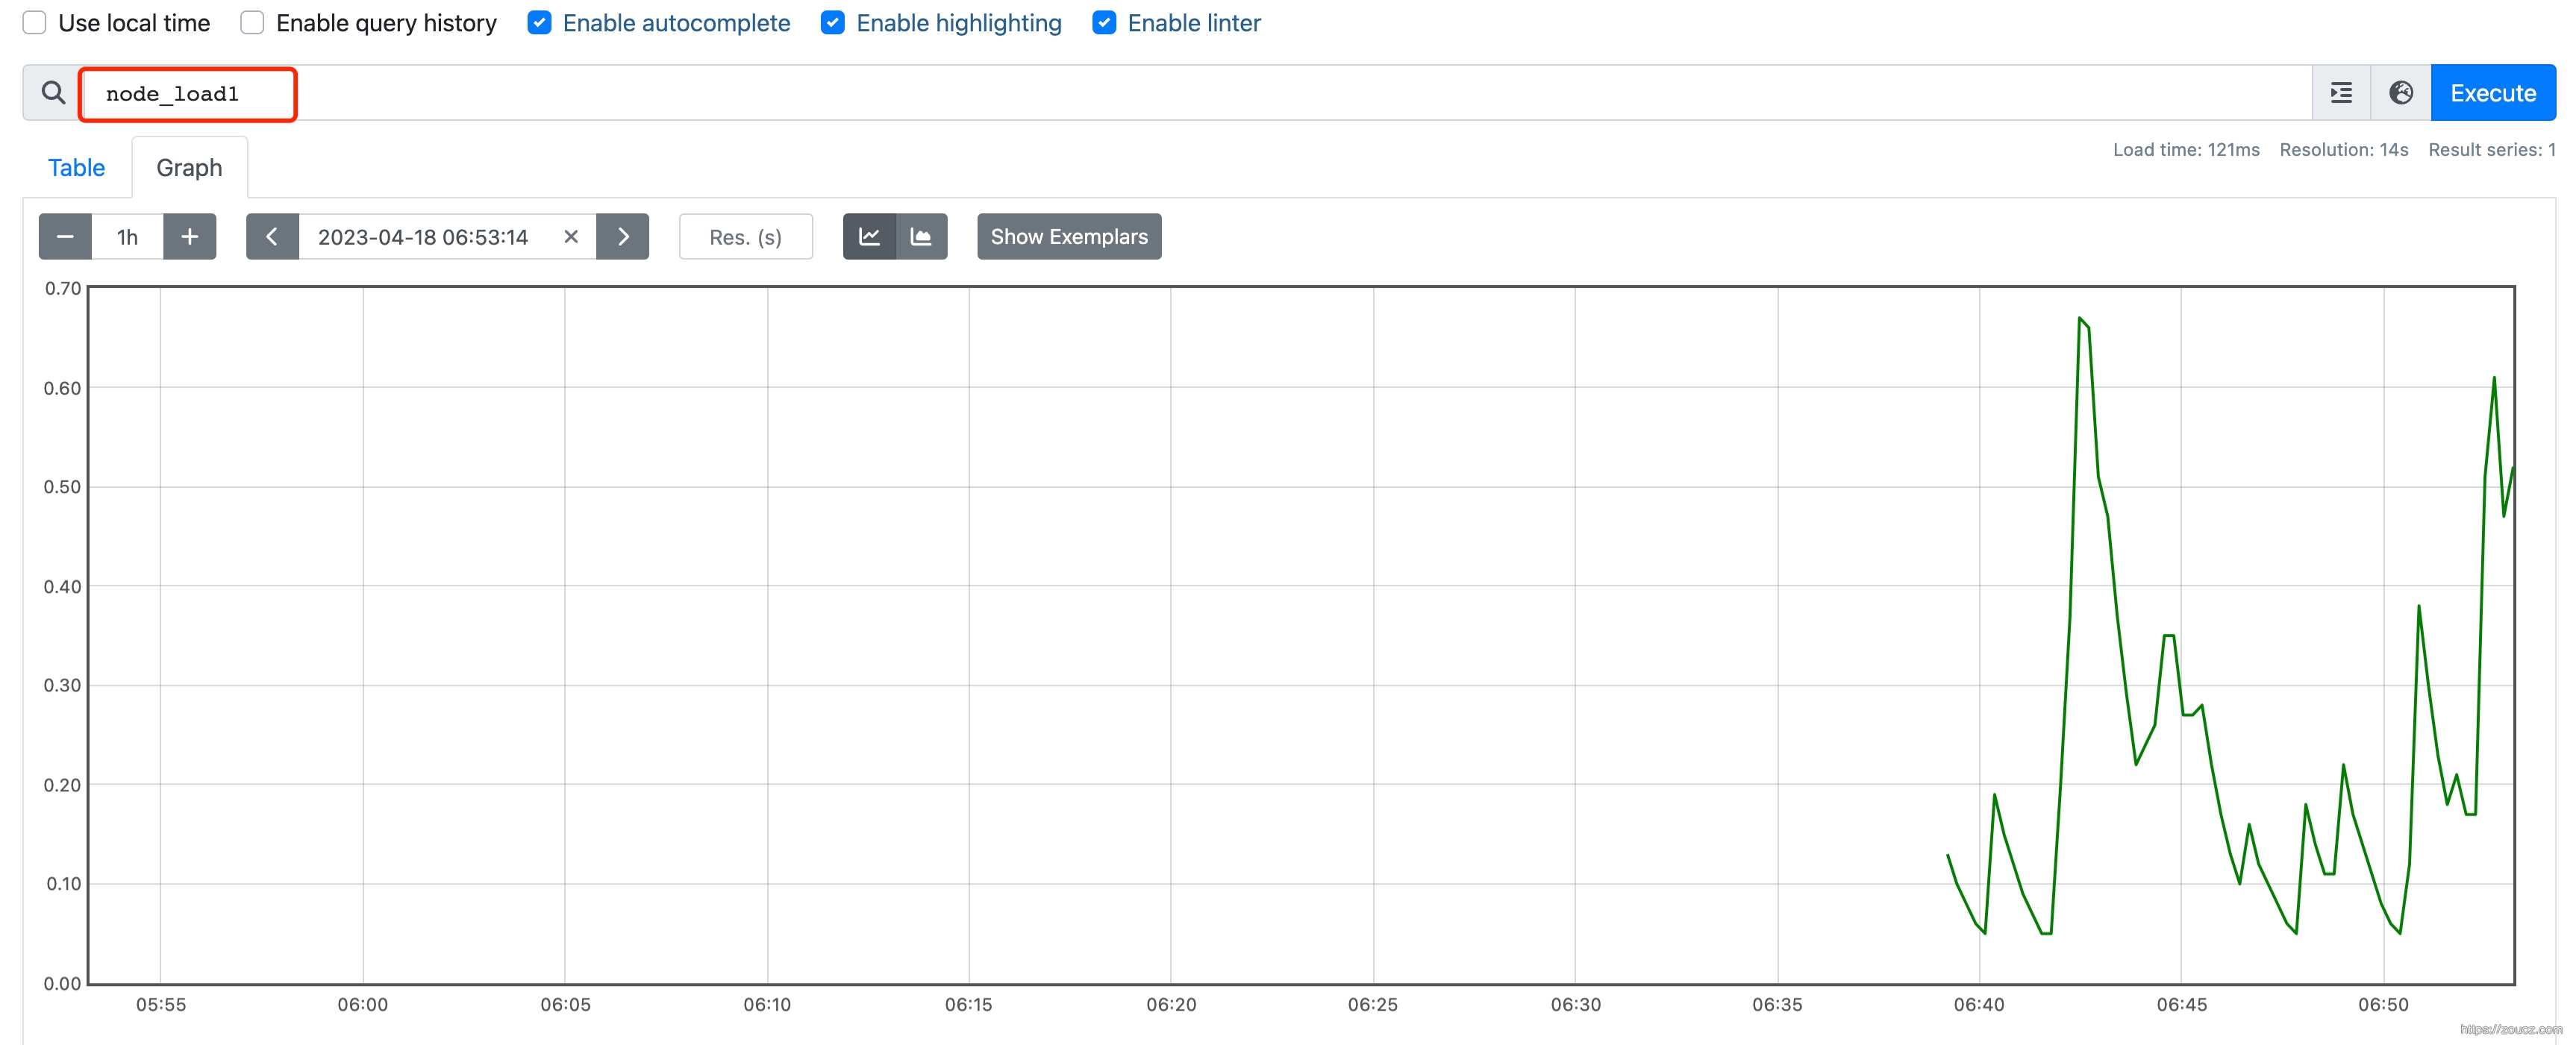
如 node_load1 CPU 的实时负载、node_memory_Active_bytes 内存用量。
Histogram 直方图
在客户端计算好各分段的值
1 | # HELP prometheus_tsdb_compaction_chunk_range Final time range of chunks on their first compaction # TYPE prometheus_tsdb_compaction_chunk_range histogram prometheus_tsdb_compaction_chunk_range_bucket{le="100"} 0 prometheus_tsdb_compaction_chunk_range_bucket{le="400"} 0 prometheus_tsdb_compaction_chunk_range_bucket{le="1600"} 0 prometheus_tsdb_compaction_chunk_range_bucket{le="6400"} 0 prometheus_tsdb_compaction_chunk_range_bucket{le="25600"} 0 prometheus_tsdb_compaction_chunk_range_bucket{le="102400"} 0 prometheus_tsdb_compaction_chunk_range_bucket{le="409600"} 0 prometheus_tsdb_compaction_chunk_range_bucket{le="1.6384e+06"} 260 prometheus_tsdb_compaction_chunk_range_bucket{le="6.5536e+06"} 780 prometheus_tsdb_compaction_chunk_range_bucket{le="2.62144e+07"} 780 prometheus_tsdb_compaction_chunk_range_bucket{le="+Inf"} 780 prometheus_tsdb_compaction_chunk_range_sum 1.1540798e+09 prometheus_tsdb_compaction_chunk_range_count 780 |
sample 摘要
在客户端计算好各分位的分位数、总数、计数
1 | # HELP prometheus_tsdb_wal_fsync_duration_seconds Duration of WAL fsync. # TYPE prometheus_tsdb_wal_fsync_duration_seconds summary prometheus_tsdb_wal_fsync_duration_seconds{quantile="0.5"} 0.012352463 prometheus_tsdb_wal_fsync_duration_seconds{quantile="0.9"} 0.014458005 prometheus_tsdb_wal_fsync_duration_seconds{quantile="0.99"} 0.017316173 prometheus_tsdb_wal_fsync_duration_seconds_sum 2.888716127000002 prometheus_tsdb_wal_fsync_duration_seconds_count 216 |
4.4 时间序列
从上面 node_exporter 示例中,某一时刻拿到的 一条指标数据格式为:
1 | <metric name>{<label name>=<label value>, ...} <sample value> |
prometheus 在存储数据时,会按照时间顺序将每个 “

5. 数据查询
prometheus 支持的查询方法:
下面是各种查询使用的实例。
5.1 根据指标名查询
可以直接输入属性名
5.2 函数查询
例如使用rate()函数,可以计算在单位时间内样本数据的变化情况即增长率,因此通过该函数我们可以近似的通过CPU使用时间计算CPU的利用率
1 | rate(node_cpu_seconds_total[2m]) |
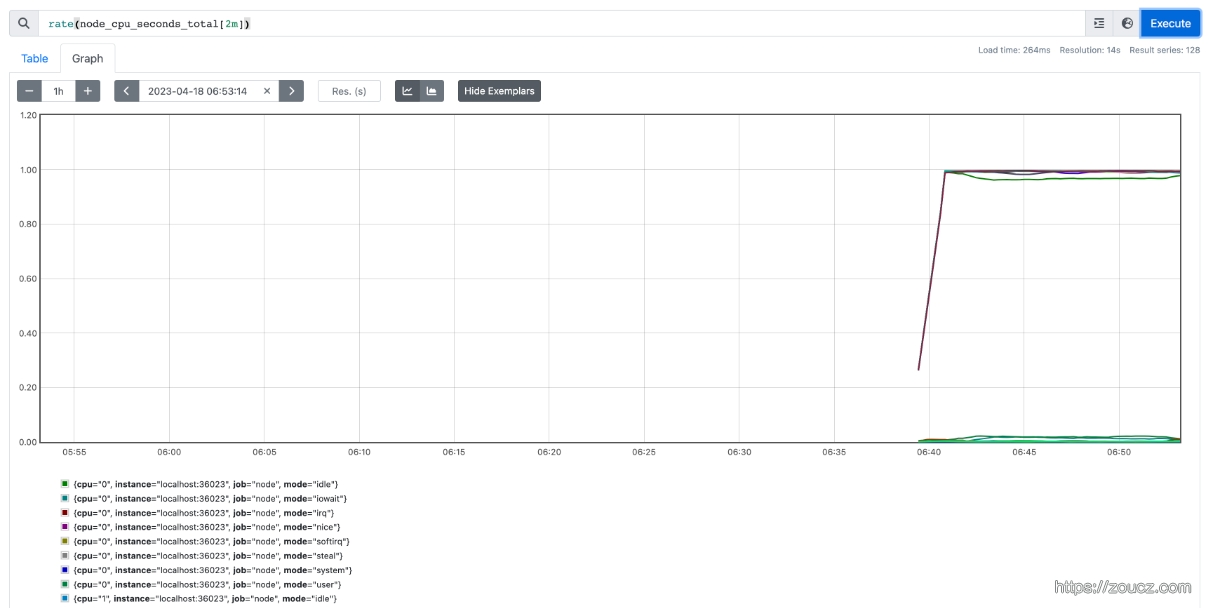
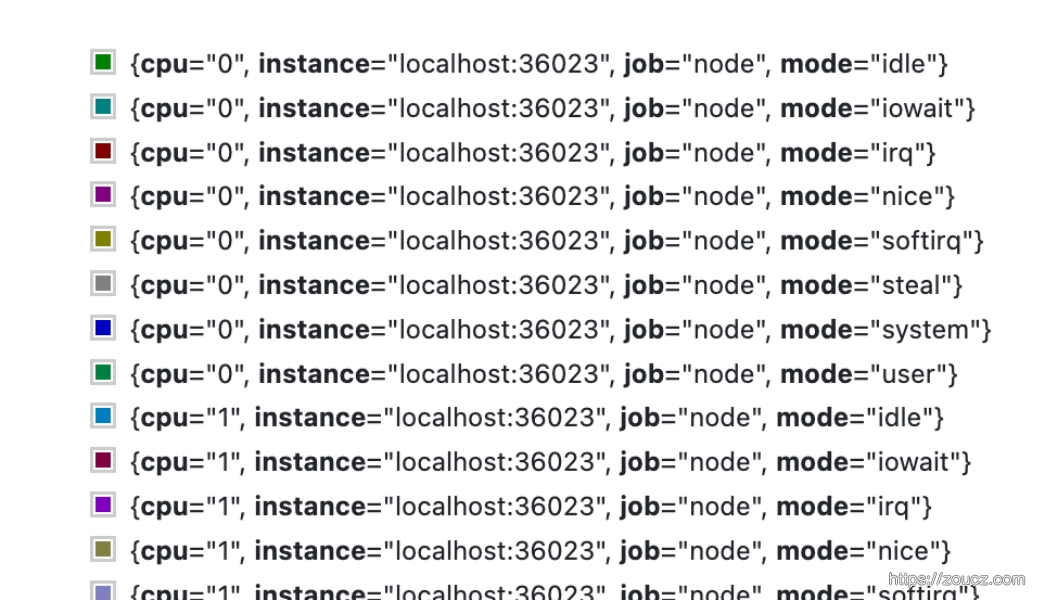
这个查询会把所有CPU、所有模式下 的数据分别统计。
支持的函数列表详见:Query functions | Prometheus
5.3 运算符
聚合运算符
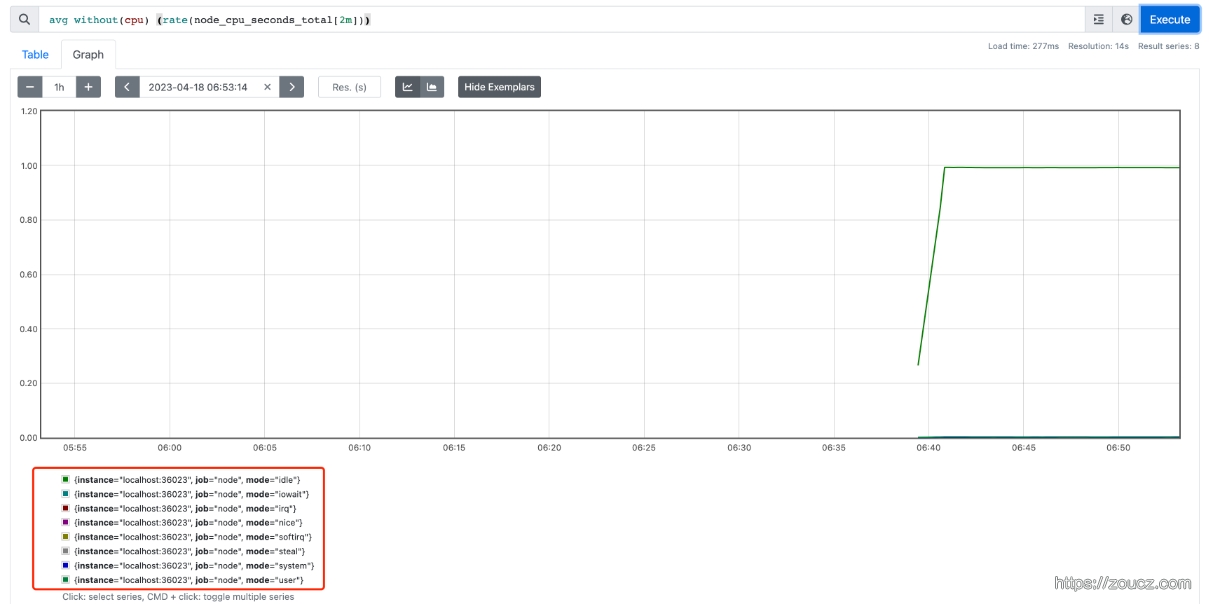
忽略某个 label 的维度,上面的图中,可以看到有 cpu、mode 两个 label,下面的语句可以去掉 cpu 的维度,聚合方法使用 avg
1 | avg without(cpu) (rate(node_cpu_seconds_total[2m])) |
如果需要计算系统CPU的总体使用率,通过排除系统闲置的CPU使用率即可获得如果需要计算系统CPU的总体使用率,通过排除系统闲置的CPU使用率即可获得
1 | avg without(cpu) (rate(node_cpu{mode="idle"}[2m])) |
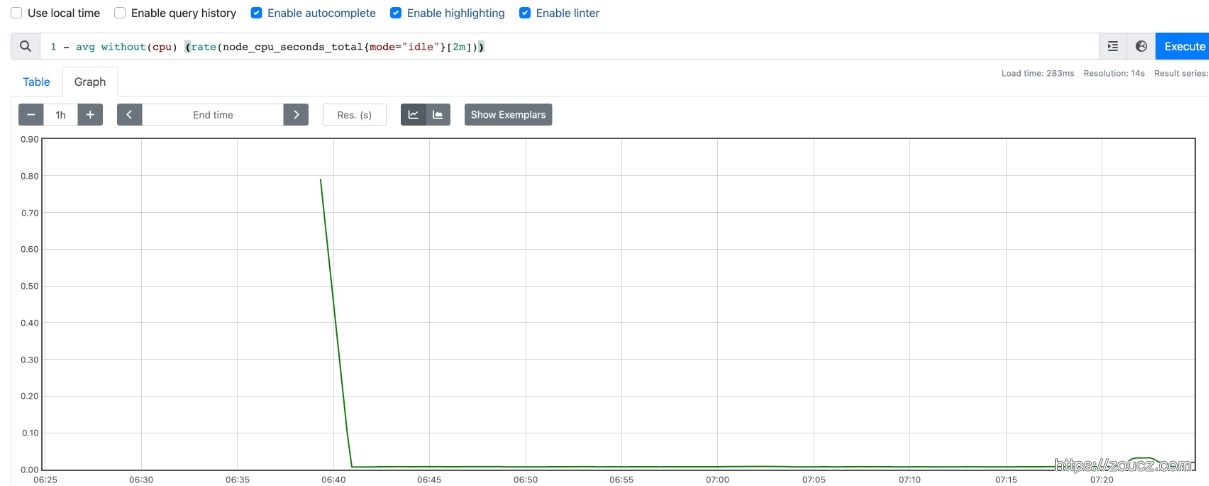
算术运算符
如果需要计算系统CPU的总体使用率,通过排除系统闲置的CPU使用率即可获得:如果需要计算系统CPU的总体使用率,通过排除系统闲置的CPU使用率即可获得:
1 | 1 - avg without(cpu) (rate(node_cpu_seconds_total{mode="idle"}[2m])) |
写一段脚本占用一个 CPU 核心,观察监控指标变化
1 | #!/bin/sh # set task to cpu0 nice taskset -c 0 yes >/dev/null & # Wait for 20 seconds sleep 20 # Kill the yes commands pkill yes |
支持的所有运算符详见:Operators | Prometheus
参考文档:
本文链接:https://www.zoucz.com/blog/2023/07/19/c4c25d00-262d-11ee-9fa0-5dbc93f9d3ee/
